Skip to content
In development · Content subject to change without notice
Sharp-tailed Sandpiper flock in flight · JJ Harrison CC BY-SA
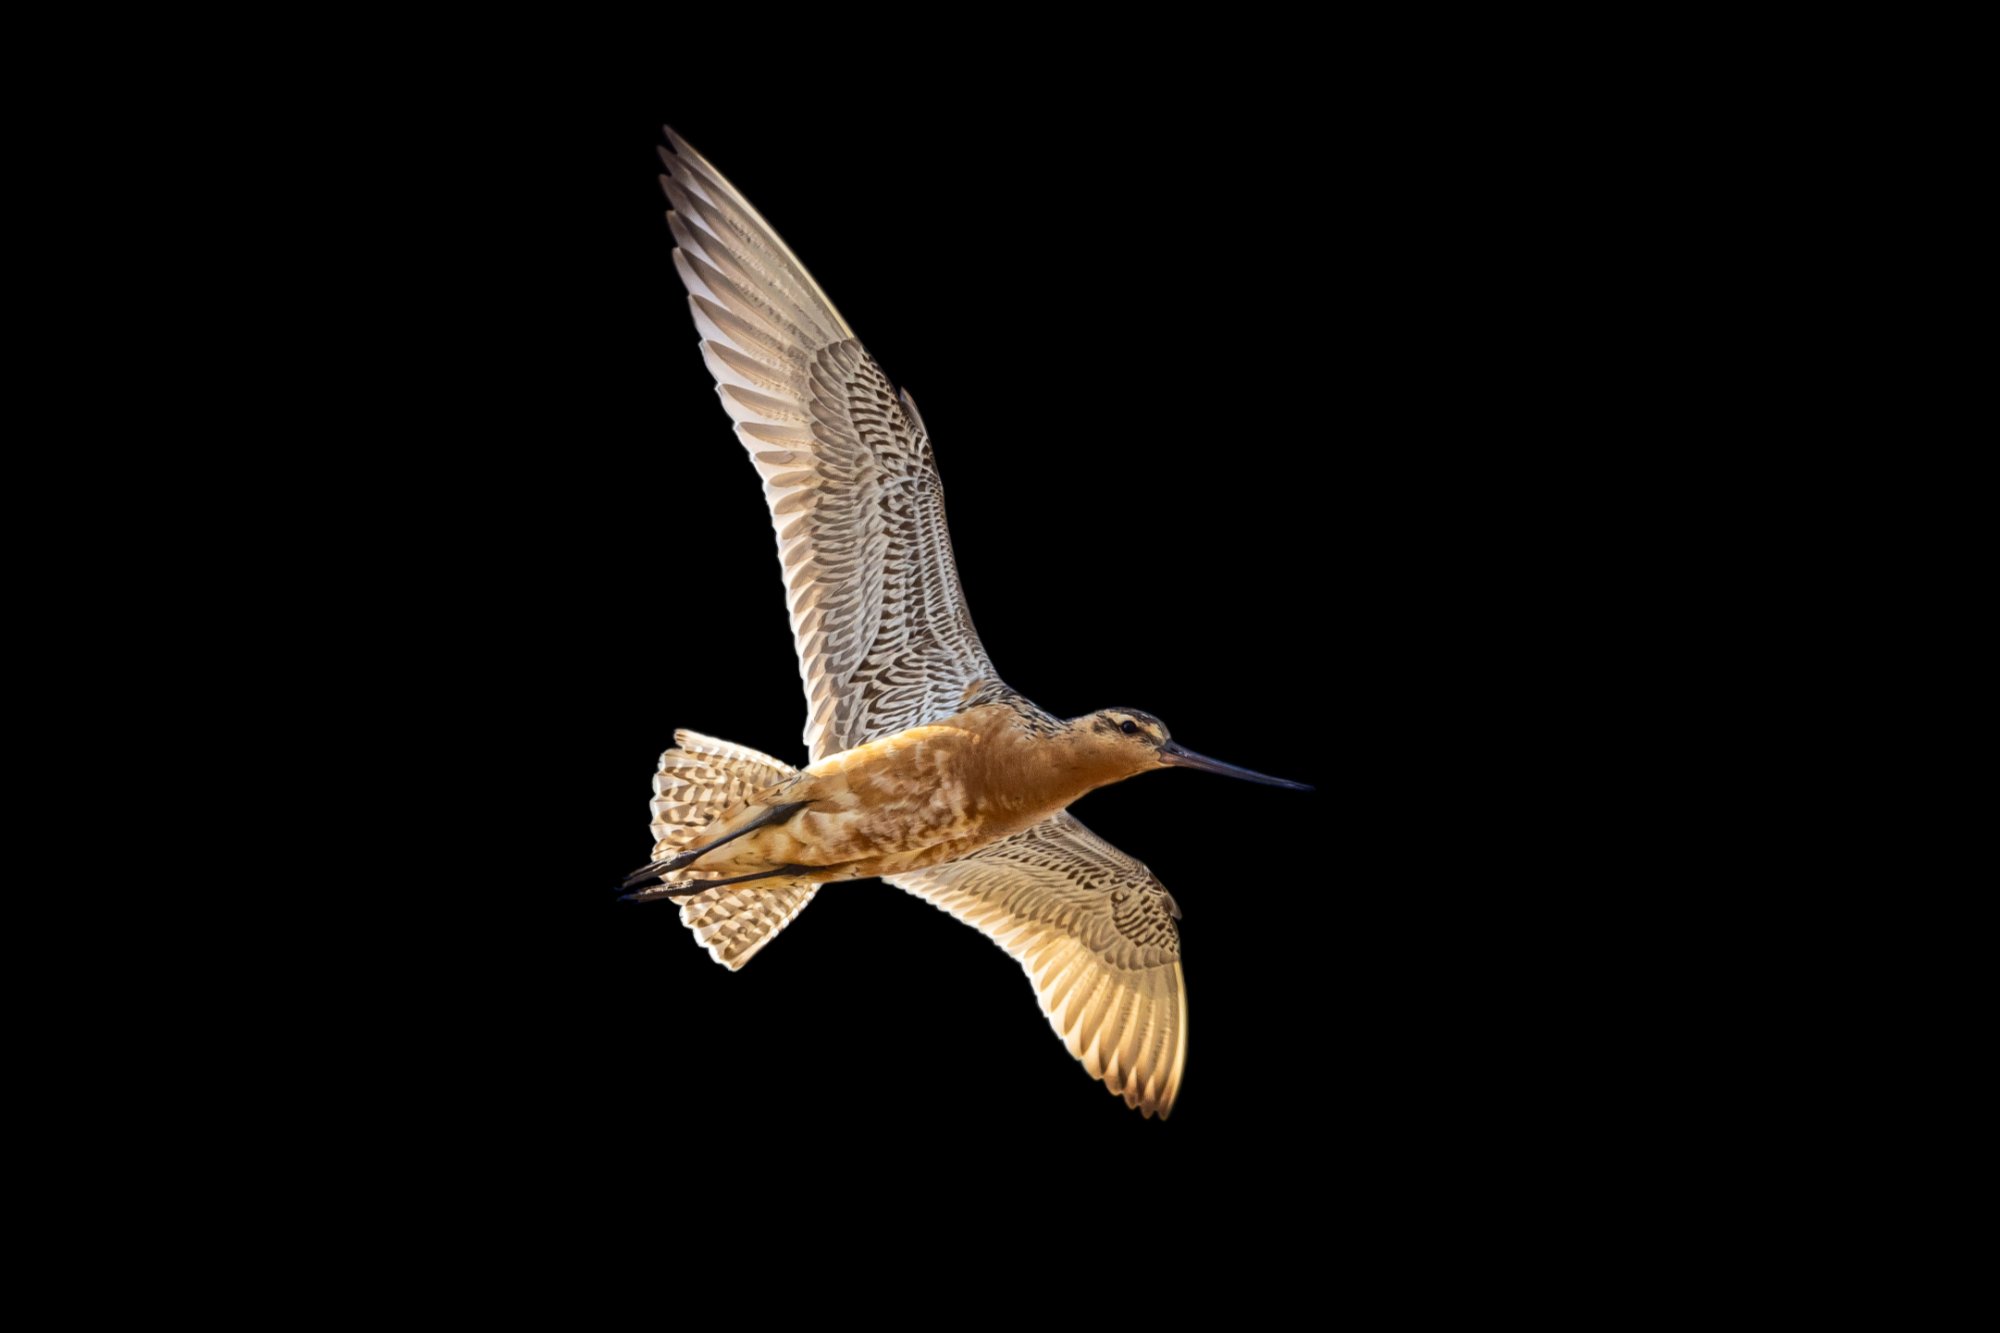
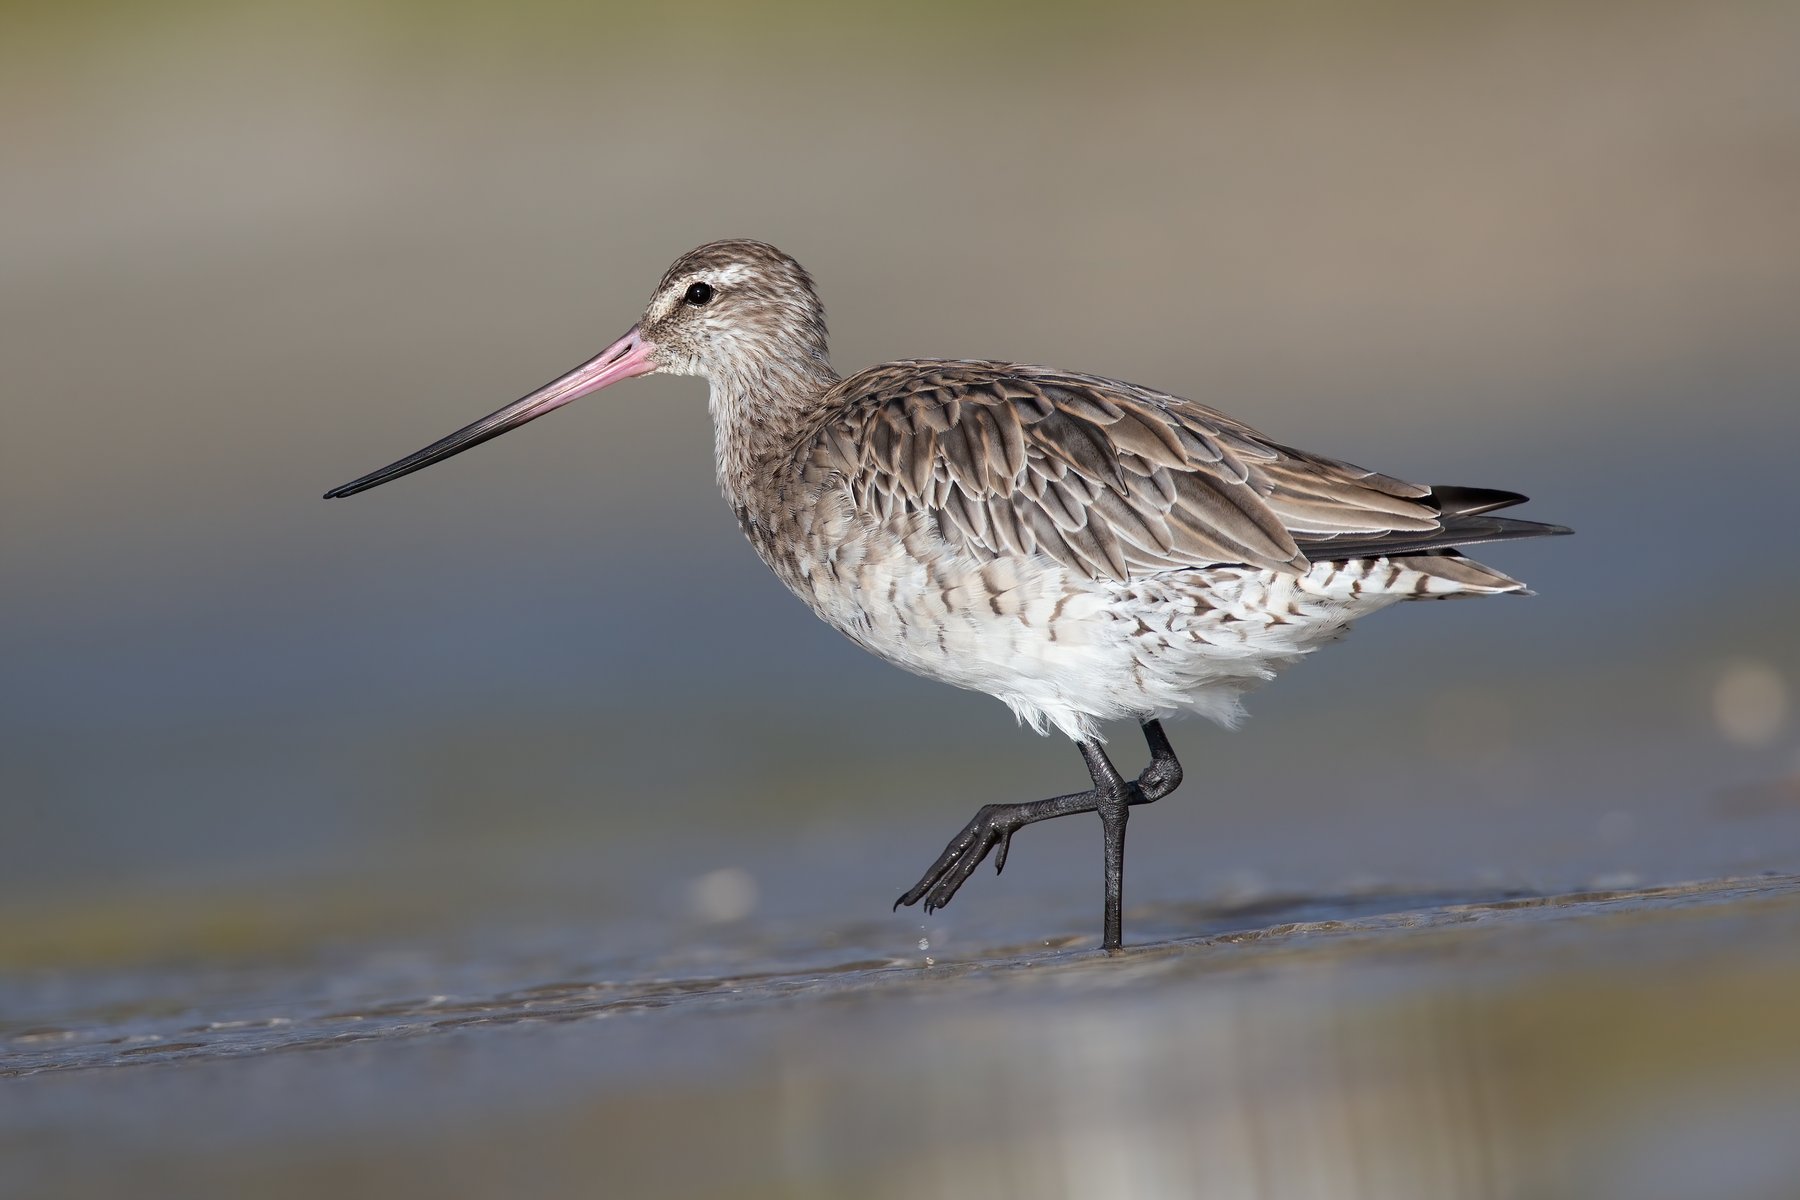
Bar-tailed Godwit · Limosa lapponica baueri

The Great Gamble

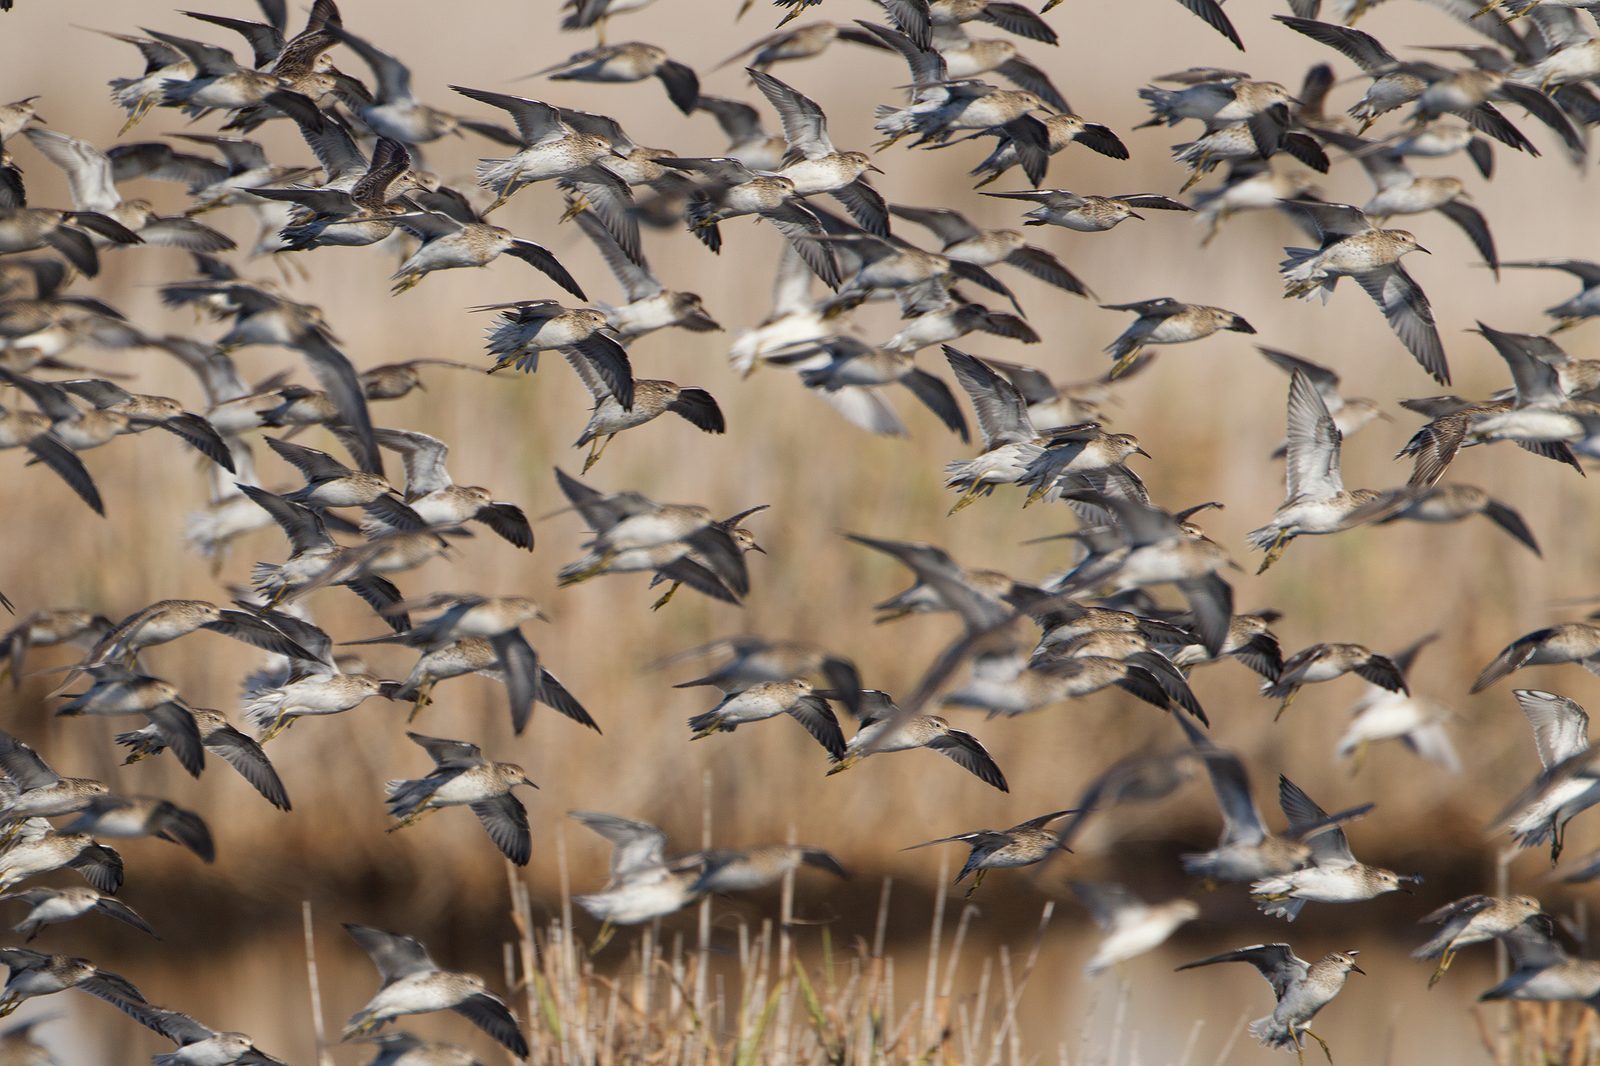
126,000 birds. One flyway. Every year is a bet placed against weather, habitat, and human decisions made on the other side of the world.

We know all we need to protect them. We just need to Act.

Bar-tailed Godwit flock · Moreton Bay · © JJ Harrison (jjharrison.com.au) / CC BY-SA 4.0
The Annual Circuit

Every leg is a gamble.
The outcomes cascade.

A Bar-tailed Godwit's year is a sequence of bets, each one staked on the result of the last. What happens in the Yellow Sea in April determines whether a bird arrives in Alaska in good enough condition to breed. What happens in Alaska in June determines how many fledglings join the southbound flight. What happens at Moreton Bay in October determines whether each bird arrives with enough reserves to survive the long wait before the northbound departure in late March.

Miss the fuel target at any stage and the cascade begins. A bird that leaves the Yellow Sea underweight arrives in Alaska too late and too depleted to breed successfully. A bird that breeds successfully but faces poor conditions at Moreton Bay may not accumulate the 4 grams of fat per day it needs to make the northbound crossing. The flyway is a system. Pressure at one point propagates through all the others.

The simulation below compresses 75 years of that system into a single screen. Each chip is 1,000 birds. The history is fixed — drag the timeline and watch what happened. Cross 2025 and the future becomes yours to decide.

The annual circuit · Limosa lapponica baueri — live simulation state
~4,000 km ~11,000 km non-stop · ~9 days Alaska Breeding ↑ NB Mar–May ↓ SB Sep–Oct Yellow Sea Mandatory staging 72% intact Moreton Bay Quandamooka Country Non-breeding · Fuelling Northbound (staged · Yellow Sea refuel) Southbound (non-stop · Pacific crossing)
Year 2025
baueri birds 126,000
Chips on table 126
Lost since 1950 –74
From baseline –37%
HISTORY
Each chip = 1,000 Bar-tailed Godwits · Limosa lapponica baueri
Population trajectory · historical (gold) / projected (blue dashed)
200k 150k 100k
Yellow Sea tidal flats 72%
Flyway cascade — leg conditions
🌊
Yellow Sea staging
72% habitat · staging adequate
🏔
Alaska breeding
62% success · ~0.8 fledglings/pair
Pacific crossing
88% annual survival · storm risk moderate
Bar-tailed Godwit in flight
Moreton Bay fuelling
5% disturbance cost · 4g/day on target
2025
← Play history or drag forward to make your decisions
19501975200020252045
Cascade consequence chain
Yellow Sea 72%
Arrival weight OK
Breeding 62%
Pacific 88%
Population holding
At current settings the population is holding near 126,000 — well below the 200,000 baseline, but not in active decline. The Yellow Sea UNESCO protection is the key factor preventing further loss.
🔒 Future decisions — reach 2025 to unlock
🌊 Yellow Sea tidal flats
CRITICAL
72%
International habitat agreements, WHS extensions. Baseline 72% (28% lost since 1950, inc. Saemangeum 2006).
Godwit Moreton Bay disturbance
WARNING
5%
Energy cost from non-breeding site disturbance. Dog FID 200m, human 75m, drone 150–200m. This is where Stewards make a difference — present at the site, observant, recording.
🏔 Alaska breeding success
WARNING
62%
Fledgling production per pair. Affected by arctic warming, predator pressure, and arrival condition — which depends directly on Yellow Sea staging quality.
✈ Pacific crossing survival
DANGER
88%
Annual survival on the southbound non-stop Pacific crossing, ~11,000km, ~9 days. Climate change increases storm frequency and severity. One severe event can cause mass mortality.
Gazza — Bar-tailed Godwit
Gazza
Bar-tailed Godwit · sixteen Pacific crossings
Press Play on the timeline. Watch seventy-five years of real data — the Yellow Sea losses, the breeding seasons, the Pacific crossings. When you reach 2025, the future decisions unlock and the real work begins. Move a slider to hear from me.
Gazza is watching the sliders — move one to hear from him
About the model

Historical data (1950–2025) is derived from published AWSG count records, Studds et al. (2017), and Yellow Sea habitat loss estimates. Population figures prior to systematic counts (~1974) are modelled backward from known data. The 1950 baseline of ~200,000 represents the estimated pre-degradation maximum for baueri. Future projections use a four-stage Leslie matrix. The model is simplified for educational use — it illustrates sensitivity to pressure changes, not precise prediction. 1 chip = 1,000 birds. At N₀ = 126,000 there are 126 chips on the table. At the 1950 baseline, there were 200.

Key references

  • Studds et al. (2017). Rapid population decline in migratory shorebirds relying on Yellow Sea tidal mudflats. Nature Communications, 8.
  • Battley et al. (2012). Contrasting extreme long-distance migration patterns in bar-tailed godwits. Journal of Avian Biology, 43(1).
  • Murray et al. (2014). Filling the gap: conserving migratory shorebirds at key stopovers. Emu, 114(2).
  • AWSG (2024). Australasian Wader Studies Group — baueri subspecies count data, east coast Australia.
  • Ma et al. (2014). Rapid loss of tidal flats in the Yellow and East China Seas. Regional Environmental Change.
  • Conklin et al. (2022). Bar-tailed Godwit tracking records — B6 record flight. Global Flyways / Movebank.

You can't fix the Yellow Sea from here.
But the disturbance slider?
That one's yours.

The Shorebird Steward Program trains people to move that number — at Moreton Bay, on the ground, with the birds in front of them.

Become a Steward See the sites
Conversations With Birds